
One of the things we do in the Kinvolk Labs team is provide expert technical consulting for customers who are experiencing issues with their Kubernetes or Linux environments — from security audits to networking troubles to troubleshooting puzzling performance problems.
A few weeks back, video advertising technology company Smartclip reached out to us at Kinvolk to investigate performance issues with their Kubernetes deployment. In this blog post, I will give you some insight into our processes and explain how we rapidly identified and solved the problem, using BPF tools from the BCC project. Finally, I’ll explain how Inspektor Gadget enables you to easily have access to these same BPF tools for your own Kubernetes installation.
Description of the problem
The Kubernetes cluster runs, among other things, nginx with fluentd and Apache Flume to handle logs. After deploying a new version of Kubernetes, the devops team noticed a performance regression issue in fluentd: it became unable to handle the logs fast enough and it kept buffering the logs until it reached the limit.
Unfortunately, that regression issue was only visible after a few days in production and, despite the team’s attempts to create a reproduction scenario in a dev environment, could not be reproduced in testing outside of production. It was also more likely to happen in the evening when there is more traffic to handle.
Initial ideas to investigate
The upgrade implied several changes: a new version of the Linux kernel, a new version of Kubernetes, a different Docker version, etc. In order to find out which change caused the problem, the Smartclip team isolated the different changes one by one until they found the one change that caused the regression issue: updating from Kubernetes v1.14.4 to v1.16.4.
It was surprising at first: I didn’t see any reason why any Kubernetes component (kube-apiserver, controller managers, kubelet, etc.) should cause the applications (fluentd and Apache Flume) to go slower.
I was given ssh access to one good node (running Kubernetes v1.14.4) and one bad node (running v1.16.4) so I could find out what was the difference between them. My initial ideas were to compare the following between the two nodes:
- Linux distribution version
- Kernel version and configuration
- Docker version
- Cgroup configuration of the pod (cpu, blkio)
- Docker image used by the pods -Kubelet configuration
However, I didn’t see any difference between the good node and the bad node.
Using the BCC CPU profiler
The BPF Compiler Collection (BCC) project contains tools for performance analysis. One of them is a CPU profiler : it works by taking samples of kernel or userspace stack traces at timed intervals, and counting how many times each of them is visible.
The performance issue only happened in production and it is not advisable to install new tools on production nodes without testing. Fortunately, BCC and its CPU profiler can be executed as a container without installing it on the node.
docker run --rm -ti --privileged \
    --net=host --pid=host \
    -v /usr/src:/usr/src \
    -v /lib/modules:/lib/modules \
    docker.io/kinvolk/bcc \
    /usr/share/bcc/tools/profile -d -f -K -p $FLUENTD_PID 10
You can find the container image in Kinvolk’s public container repository at
docker.io/kinvolk/bcc. If for some reason you need to build your own image,
you can use the new section in the GitHub action that we
contributed
upstream
a month ago.
This command prints the kernel stack traces ordered by frequency, from the least frequent to the most frequent. This allows the user to look at the last lines of the output to get the most significant ones. The last line of the output was this kernel stack:
thread.rb:70;xen_hvm_callback_vector;xen_evtchn_do_upcall;irq_exit;__softirqentry_text_start;net_rx_action;ena_io_poll;ena_clean_rx_irq;napi_gro_receive;netif_receive_skb_internal;__netif_receive_skb;__netif_receive_skb_core;ip_rcv;ip_rcv_finish;ip_forward;ip_forward_finish;ip_output;ip_finish_output;ip_finish_output2;dev_queue_xmit;__dev_queue_xmit;__qdisc_run;sch_direct_xmit;dev_hard_start_xmit;br_dev_xmit;br_forward;__br_forward;nf_hook_slow;ebt_out_hook;ebt_in_hook;ebt_ip_mt;ebt_ip_mt 3
This stack with the function ebt_ip_mt() is listed only on the bad node. We
found a different behaviour between the good node and the bad node. It is worth
exploring this.
Analysis of the problem
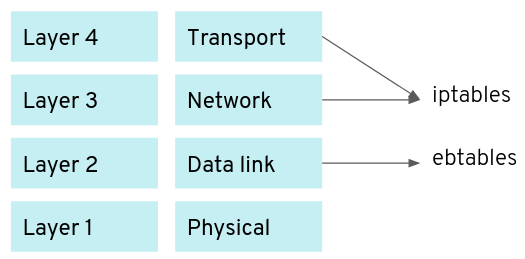
Looking at the kernel sources, ebt_ip_mt() is part of Netfilter, responsible
for filtering packets at the data link layer. Many people are familiar with the
iptables command to check the firewall rules at the network and transport
layer, but Netfilter also has the command ebtables for the firewall rules at
the data link layer.
This gives the idea to check the bridging firewall rules with ebtables -L. On
the bad node, I notice the following:
Bridge chain: KUBE-DEDUP, entries: 4268, policy: ACCEPT
-p IPv4 -s e2:3f:9b:74:a8:7a -o veth+ --ip-src 10.2.207.0/24 -j DROP
-p IPv4 -s e2:3f:9b:74:a8:7a -o veth+ --ip-src 10.2.207.0/24 -j DROP
-p IPv4 -s e2:3f:9b:74:a8:7a -o veth+ --ip-src 10.2.207.0/24 -j DROP
-p IPv4 -s e2:3f:9b:74:a8:7a -o veth+ --ip-src 10.2.207.0/24 -j DROP
-p IPv4 -s e2:3f:9b:74:a8:7a -o veth+ --ip-src 10.2.207.0/24 -j DROP
-p IPv4 -s e2:3f:9b:74:a8:7a -o veth+ --ip-src 10.2.207.0/24 -j DROP
-p IPv4 -s e2:3f:9b:74:a8:7a -o veth+ --ip-src 10.2.207.0/24 -j DROP
-p IPv4 -s e2:3f:9b:74:a8:7a -o veth+ --ip-src 10.2.207.0/24 -j DROP
-p IPv4 -s e2:3f:9b:74:a8:7a -o veth+ --ip-src 10.2.207.0/24 -j DROP
-p IPv4 -s e2:3f:9b:74:a8:7a -o veth+ --ip-src 10.2.207.0/24 -j DROP
(...)
The same rule is repeated thousands of times in the KUBE-DEDUP chain. This
means that each network packet will be evaluated against that rule thousands of
times. The chain name KUBE-DEDUP suggests that it was not a rule added
manually but programmatically by Kubernetes. This looks like a bug.
Searching in the Kubernetes sources, I found that the kubenet network plugin used in the Kubernetes cluster indeed adds such a rule, but there is a function that specifically checks if the rule is already added, to avoid adding it several times. Obviously, there is something wrong with that check.
At this point, in order to see how kubenet is using ebtables exactly, I turned
to another BCC tool:
execsnoop
.
This traces new processes and displays the command line for each of them. Since
I am only interested in the ebtables process, I just add a grep ebtables
and let this run for an afternoon until I see kubenet executing ebtables.
docker run --rm -ti --privileged \
    --net=host --pid=host \
    -v /usr/src:/usr/src \
    -v /lib/modules:/lib/modules \
    -v /sys/kernel/debug:/sys/kernel/debug \
    docker.io/kinvolk/bcc \
    /usr/share/bcc/tools/execsnoop  \
        | grep ebtables
After a few hours, I get some interesting output:
ebtables         5260   2411     0 /sbin/ebtables --version
ebtables         5261   2411     0 /sbin/ebtables -t filter -L KUBE-DEDUP
ebtables         5262   2411     0 /sbin/ebtables -t filter -L OUTPUT --Lmac2
ebtables         5263   2411     0 /sbin/ebtables -t filter -L KUBE-DEDUP --Lmac2
ebtables         5264   2411     0 /sbin/ebtables -t filter -L KUBE-DEDUP --Lmac2
ebtables         5265   2411     0 /sbin/ebtables -t filter -A KUBE-DEDUP -p IPv4
                      -s e2:3f:9b:74:a8:7a -o veth+ --ip-src 10.2.207.1/24 -j DROP
We see kubenet listing the rules in the KUBE-DEDUP chain, and then proceeding
to add the rule. However, the rule shown in the command line is slightly
different from the rule listed above: kubenet adds 10.2.207.1/24 but then
ebtables lists 10.2.207.0/24. If you’re familiar with
netmask
, you’ll know that ebtables
is doing the right thing to discard the final “.1” on a /24 netmask. Here is
what’s happening:
- Kubenet lists the rules to check if the rule with
10.2.207.1/24is there. - Kubenet does not find it in
ebtables -L’ output because it lists the rules with10.2.207.0/24. - So Kubenet runs the
ebtables -Acommand to append a new rule. ebtablesparses the rule, discards the.1and appends the rule with10.2.207.0/24.- Each time this process is repeated, a new rule is added. Over time, the rule can be repeated thousands of times.
I reported the bug at https://github.com/kubernetes/kubernetes/issues/89633 with the links to the lines of code that cause the issue. The bug was introduced in v1.16.0 and fixed in v1.18.0 with backports in v1.16.8 and v1.17.3.
For Smartclip, the issue is resolved by upgrading to a Kubernetes version with the fix. Monitoring on the ebtables rules list was also added in order to trigger an alert when the amount of rules is excessive, just in case this issue happens again.
Bringing the BCC CPU profiler into Inspektor Gadget
When managing a cluster in production, it is good practice to focus on automation and avoid interacting with individual nodes, individual pods or individual processes. However, in order to investigate the issue, I needed SSH access to the Kubernetes nodes and I identified the pod with fluentd and its main PID. Then I launched a new container containing the BCC tools and executed the CPU profiler on the fluentd PID. This is error-prone and more complicated than it could have been.
Inspektor Gadget exists in order to make this process easier for Kubernetes
system administrators. You can now achieve everything I did from the kubectl
command line with kubectl gadget profile without needing to SSH to the nodes.
The execsnoop BCC tool is also available via kubectl gadget execsnoop. Under
the hood, Inspektor Gadget will execute the BPF programs on the nodes to get
traces from the right pods which can be selected with Kubernetes labels — no
need to SSH into the nodes, nor to work out the PIDs you need to attach the BPF
program to.
Following this investigation, we released a
new version of Inspektor
Gadget
including both profile and execsnoop. We also show examples how to use
profile
and
execsnoop
.
As René Wagner, technical director data platforms at Smartclip, summarized the engagement: “Through their knowledge of the latest Linux kernel technologies, the Kinvolk Labs team got to the bottom of our problem in a couple of days. We were really impressed by their expertise and recommend their services to anyone in a similarly challenging situation. As a bonus outcome from the project, we are also really happy to have discovered Inspektor Gadget, which is now an essential tool for all our Kubernetes admins.”
If you have used Inspektor Gadget and find it useful, or have a suggestion for a useful gadget we could add, please let us know , or (even better) let the world know (tweet @kinvolkio with #InspektorGadget).